THE FREEZING ECONOMY’S HOT CPI
EDU DDA Feb. 12, 2025
Summary: At first, these seem like contradictions: a “red hot” CPI at the same time one of the world’s oil giant’s reports laying off one-fifth of its entire workforce. After all, the latter is in response to the realities of oil and gas prices and margins which are main inputs into consumer price measures. Reconciling these two outcomes is not all that difficult once you realize it isn’t a hot CPI so much as a heated interpretation of it, one free from legit economics. It is economics (small “e”) which helps us explain a lot, including the danger of the Beveridge Curve represented by all these things.
The shock of the day wasn’t the CPI. January has become notorious for the index’s high calculations. This one was no exception, even outdoing last year’s which had triggered the same “higher for longer” acceptance in the media and among most FOMC policymakers. By April, the tone among them had shifted decisively toward no rate cuts in 2024 and several publicly considering, if not lobbying for, rate hikes.
While it is no different here and now, the oil market’s performance importantly is sharply contrasting with this time last year – so much so, Chevron shocked the world this afternoon and, to those paying attention, greatly overshadowed the “hot” consumer price estimates. The company announced it is planning to shed between 15% and 20% of its global workforce.
Those are not typos.
The economy which forgot how to grow, and the weak gasoline prices/margins created by it, have claimed its latest casualty, and it’s a big one. I don’t only mean by size, the implications span far beyond Chevron’s bottom line and the wider energy marketplace, as this anecdote might further signal the economy (globally) heading up that flat part of the Beveridge Curve after all.
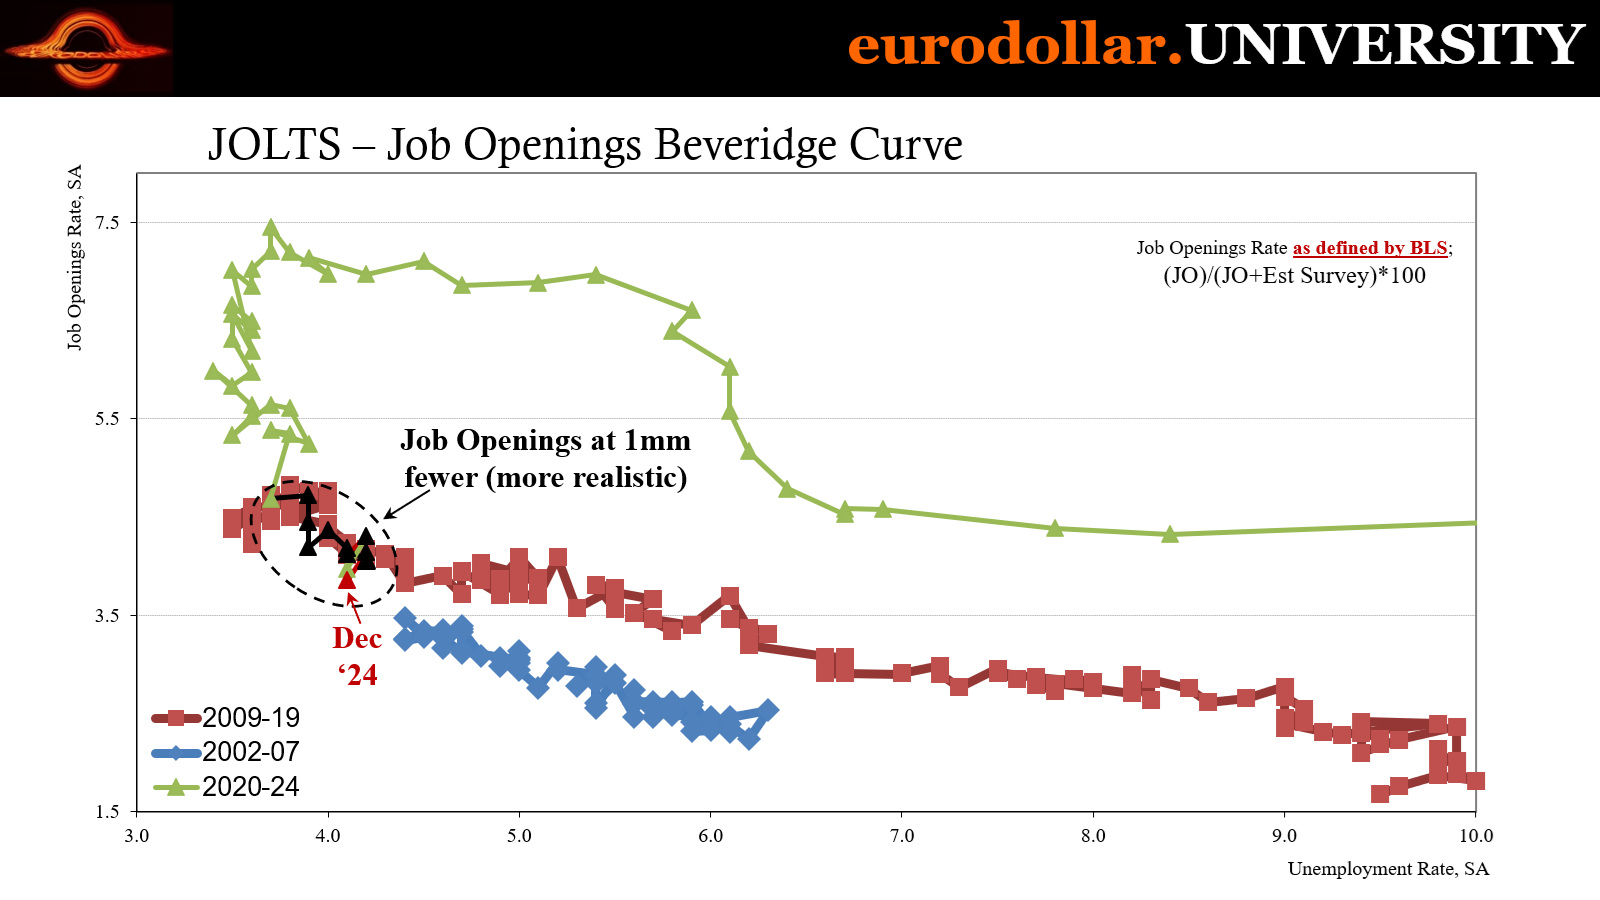
Beveridge Curve Review
This curve measures the relationship between demand for workers and the supply of them. On the one side, the Y-axis, sits labor demand measured by job openings, in this case, unfortunately, the version prepared by the JOLTS series. The X-axis, labor supply, is really a measure of labor slack as captured by the unemployment rate, an equally suspect metric all its own.
Both tend to vastly overstate the condition of the labor market which helps us because if one or both sides flash weakness, that warning comes from a position of overestimation of strength.
At some point, it stands to reason, when demand for workers drops so low, employers aren’t just putting on a hiring freeze they begin to actively get rid of employees they already have. No hiring turns into lots of firing.
A complete examination of the Beveridge Curve and its implications can be found here.

Labor hoarding is a normal part of every cycle and in every phase. Naturally, companies are reluctant to give up workers over every short run slowdown. Unless the business is staffed by low-skilled labor that is easily replaced with a ready supply on standby (slack), companies instead take the near-term hit to profits understanding the costs of letting go skilled staff outweigh the support to pressured bottom lines provided by layoffs.
In this post-pandemic, forgot-how-to-grow cycle, the degree and persistence of labor hoarding has been truly remarkable, beyond any extent witnessed in modern history. Hirers were scarred by their experiences in 2021, in particular, when, as business was ramping back up seemingly all-at-once, the lockdowns, the disease, the savings cushion provided by the federal government (not only in America) made that supply of “slack” workers exceptionally rigid.


Just like the economy-wide supply shock, that imbalance of demand against slow-to-respond supply was reconciled in the only ways possible – first, with soaring prices meaning, in this case, fast-rising wages. However, that wasn’t the only reconciliation, the other how those soaring prices priced some businesses right out of the labor recovery entirely, partly explaining why the number of jobs (or number of hours) never came close to fully recovering despite the fast-pace of the initial rebound.
The experience encapsulated in both negatively affected businesses to the extent they’ve been hoarding workers for years even as most of them have long since realized they have too many for the actual operations they’re running – underneath the nominal illusion the actual physical or real amount of work and produce (goods or services) is alarmingly less than most realize.
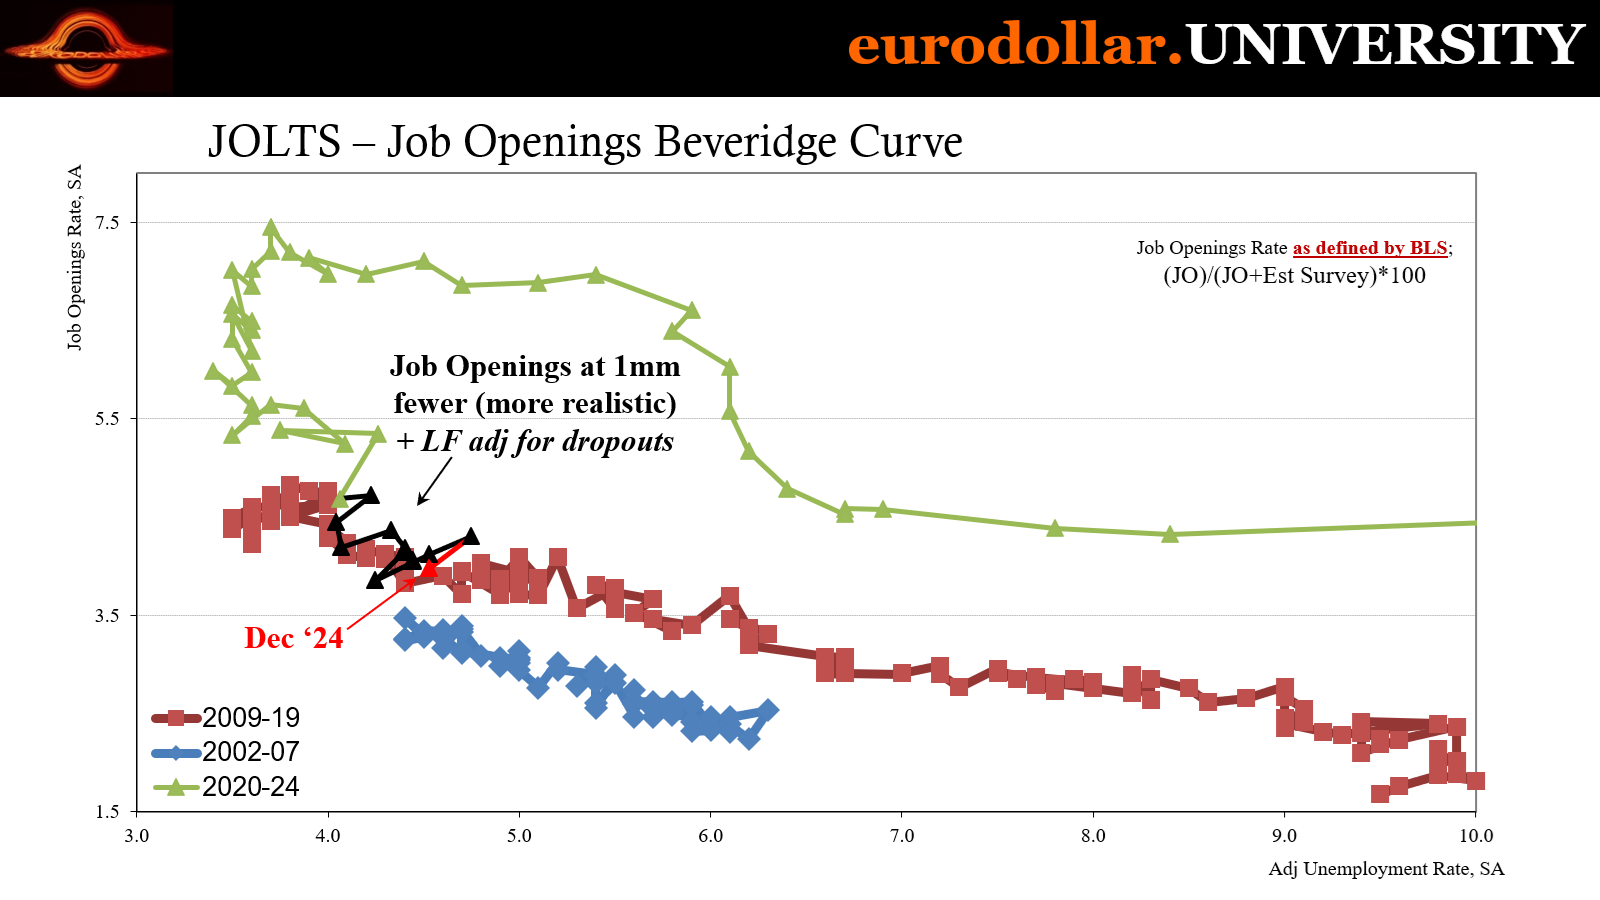
Despite that clear imbalance, companies have repeatedly and almost uniformly chosen to address their labor disparities by reducing headcounts in other ways, mainly what is called “attrition.” This strategy begins with the hiring freeze as a given; there is no sense increasing staff when the current staff is already too large. Thus, hiring rates have plunged to concerning depths and putting the US in range of transitioning to the wrong side of the Beveridge Curve.
What Chevron represents is not simply a unique case. If anything, it is a more extreme one better supported by certain fundamentals of its industry. In other words, Chevron maintained far too many employees based on real factors rather than solely expectations and unrealistic forecasts.
As far as the latter, there have definitely been those. For energy, the myth of the China recovery has been there right from the tail end of Zero-COVID. Oil firms were understandably – if still unrealistically – optimistic about, first, reopening and, then, some combination of “stimulus” plans which majority believed would ultimately hit upon the right mix and get the Chinese economy going again. As the world’s largest importer of oil, that was a potential groundswell of demand just waiting under the surface.
Plus, the entire time the petroleum industry was kept waiting and wanting OPEC+ supported crude prices with its supply manipulations. For Chevron, they could get paid a higher oil price, therefore also gasoline, biding time for when Beijing got its act together. Combined with the soft-landing or even no-landing American economy, maybe even a Euro recovery, too, it was an easy choice to keep hoarding oil workers.
Until it wasn’t.


What changed recently? To start with, the oil glut once feared as a future prospect is becoming a today reality. The WTI futures curve, for example, has collapsed toward contango over the last nine days. As it stands, with the oil benchmark is heading once more back toward $70, this time as the one-month spread slides to $0.14 while the three-month calendar slips under $0.70.
The last time the futures curve was this flat it had been early December when the seasonal price swing was getting underway only to underwhelm, especially in gasoline. Between then and now, oil was supported by several non-economic factors, from the imposition of more sanctions by the outgoing Biden administration which produced a large if temporary spike and dramatic steepening of the WTI curve, to fears of “trade wars” and their potential impact on the smooth flow of physical supply.
In spite of those, demand concerns remained and have brought the curve back to its current position. If it does go any farther, it would simply confirm the petroleum glut as more than a possibility.
While the term itself glut like oversupply (intentionally) implies supply as the main imbalance, demand is the real problem and it’s not just Chinese. This is why CME wholesale gasoline is an important indication since that applies far more to domestic circumstances and fundamentals. Whereas oil is the main input and main input cost in motor fuel, by being held artificially high thanks to OPEC and geopolitics, all that has done is to further squeeze margins since the lack of end user demand means refiners like Chevron have been – and expect to continue to be – unable to pass on those oil costs.
Yet another example of what isn’t inflationary about high crude prices.
I’ve tracked refiner behavior since last summer (that timing again) and Chevron cited its too-thin refinery margins as the main reason for its worker dishoarding decision; low refining margins have already having led to an outright loss for the company, while also giving management little further reason to hope for a turnaround in them. The forecast for rising gasoline demand on purported economic strength and strength of the American labor market never materialized, a fact realized as a fact in gas prices and now the response from a major supplier.
With everything that seemed to be going in the right direction, Chevron’s choice to now throw in the towel on its workforce stands as a potential warning related to the Beveridge Curve. This might be a signal others are thinking the same with the frosty, sick economy sitting several ways inside the danger zone (hours!)


How, then, do “hot” consumer prices figure in to what is more accurately characterized as a increasingly cold economy? Hot already doesn’t seem to fit with “forgot how to grow.” After all, everyone everywhere equates higher price changes with strong demand and activity; it’s even in the language were meant to use, the employment (pun intended) of temperature metaphors.
January’s “hot” “inflation”, like last January through March, is a product of multiple non-economic factors. And where there are economics, such as another explosion of car insurance rates, the economics of them leave the economy/consumers worse off for what has very little if anything to do with today’s conditions.
As to the non-economic factors, they begin with statistical issues such as the well-worn problem with shelter prices and the imputation of them (basically making them up out of regression models to cover up how made up they are). In January, the shelter index accelerated modestly, yet even that much was enough to contribute 30% of the entire increase in the CPI.
Shelter costs may have decelerated overall, yet have a long way still to go to match reality. The mismatch is so evident even the FOMC earlier this year began to publicly disavow them.


Apart from that one, how in the world did the BLS indicate gasoline (motor fuel) rising sharply in both December and January? The seasonally adjusted CPI said the motor fuel index soared 4% in December alone, then another 1.8% last month.
Remember, a big seasonally adjusted increase means more than is expected from typical seasonal behavior. In the case of gasoline, we expect gasoline prices to rise at this time of year and so does the BLS. Therefore, those price changes need to exceed the typical seasonal increase in order for the CPI to count that as higher price changes, at least without some other interference.
What I just finished writing, and what Chevron’s massive layoff plan implicates, is gasoline prices that are doing just the opposite. How that becomes two months of fast-rising motor fuel increases is another one of these statistical oddities.
Because it is, absent some real economy surge in actual gas costs, there is going to be a “give back” at some point over the months ahead.

Other non-economic factors in the CPI start with eggs whose prices have skyrocketed. Wholesale costs are now reported well above record highs, those previously set around Thanksgiving 2022 (if you remember then). It isn’t as if demand for them has grown white-hot; on the contrary, there is now an increasingly acute shortage of supply. Not inflation, not strength, instead bird flu wreaking havoc on farmers’ flocks generating artificial scarcity.
Where there are some economics in consumer prices, those aren’t of strong demand, either. Transportation services utterly exploded, soaring by the most in any single month since 2022. This one isn’t artificial, nor is it statistical (apart from some seasonal adjustments that were themselves adjusted by the usual benchmark changes. As an aside: the CPI itself, the unadjusted series, is never revised or benchmarked, by law, since it is tied to the COLA of social security, meaning that what does get revised annually is only the seasonal adjustment factors applied to the unadjusted series which then can produce distortions like a few we’re seeing in January[s].)
Rather, these large and painful auto insurance raises are largely reactions to prior cost increases of cars and trucks, basically second even third order “inflation” effects left lingering from the supply shock itself. That means while these are indeed due to economic circumstances, those circumstances took place years ago and have nothing to do with today’s economy let alone it being somehow “hot.”
This is how price changes end up looking “sticky.” It’s not underlying inflation, the distortions left behind by the phase shift in prices have to completely filter through the entire system, and do so more than once or twice. Car insurance premiums is one primary example, as has been oil prices. OPEC’s response to the demand destruction wrought by repeated price shocks is itself a third order effect, in this case a misguided attempt to hold prices up rather than let them go to a more stable demand-driven equilibrium.

And that, in turn, helped lead to another – call it fourth order effect – which had Chevron and too many others hoarding workers long past their economic usefulness thereby also keeping the labor market on the vertical part of the Beveridge Curve and away from its flat section where it really does need to go for a final rebalancing of the past half decade.
Those are a few reasons and evidence for how the CPI can be “hot” at the same time the economy is absolutely not.
One final set of critical evidence comes from the Atlanta Fed’s sticky and flexible CPI data (if you missed my previous explanation on what properly constitutes sticky rather than the term thrown around casually in the mainstream, here is a complete explanation.) The sticky index, using the true and correct definition of the term, slowed down to just 3.58% year-over-year, its lowest rate of the entire cycle. Not only that, it has clearly decelerated over the past few months in sharp contrast to the near-hysteria over certain interpretations of the headline CPI.
Meanwhile, the flexible index has rebounded from its summer low near -2% (after revisions), though only going as far as +1.1% y/y here in January.

In other words, the longer-term factors shown in the sticky part of the CPI continue to trend decisively in the direction of disinflation, while the flexible CPI does what the flexible CPI and generally changeable prices do in a dynamic fluctuating economy – they’re fluctuating.
January’s CPI is being treated as, well, the same as last January’s which was followed by February and March ending up in April with absolutely everyone completely convinced about the need for more rate hikes, or, at the absolute minimum, zero cuts and higher for a lot longer. The rate cutting happened anyway because the “heat” was never in the real economy, consumer prices were being supported by a menagerie of trivia rather than legit economics.
Instead, those are dripping from Chevron’s shock announcement which is itself entirely consistent with the behavior of oil prices and gasoline margins – the cold, sick economy which forgot how to grow finally going too far for this one major firm. As such, the Beveridge Curve danger like the oil glut is very real and much less theoretical at the moment.