QUITE CERTAIN ABOUT THIS UNCERTAINTY
EDU DDA Mar. 7, 2025
Summary: Practically everyone keeps blaming “uncertainty” for all the “unexpected” results showing up in more and more places. The thing is, the data is getting more certain not less. February’s labor data was conclusive across all the key aspects. Even the Establishment Survey contributed to settling the short run question in the economy, and then added much to the more important interpretation of the jobs market’s overall condition. There is no wiggle room here any longer.

Payrolls didn’t come in as a blowout, underwhelming instead. They managed to rise by just over 150,000, better than last month yet significantly below expectations, too. More importantly, setting aside how much these numbers remain overstated, they also display the same short-run pattern we’ve been expecting, the same one featured in practically every macro data series.
The only difference is the degree to which the US economy may have been boosted, and now much it might already be suffering the payback. It will be a few more months before we have a sense of that, so far the early returns are not encouraging.
Payrolls are merely the upper end of that interpretation range rather than being aligned against it.
At the other end, the Household Survey and all its components. They absolutely crashed last month, with the employment level down by nearly 600,000 and that’s not even DOGE (government cuts will begin showing up in a more meaningful way starting with March). It was the biggest single-month drop for CPS since December 2023’s awful punctuation of the labor market inflection the mainstream also entirely ignored – until its aftermath rudely intruded on the soft landing last summer.
And that still wasn’t the worst of it. Full-time jobs utterly plummeted, falling by more than 1.2 million just in February (NOTE: some of the charts do not account for the population control factors that otherwise make the series discontinuous, so, for example, there weren’t 2 million full-time jobs gained in January, that was almost entirely this statistical adjustment; I did adjust the employment estimate for the HH Survey as an illustration of what the series could like without the population factors). Part-time positions offset those only by 610,000, leaving employment to suffer the 588,000 decline.

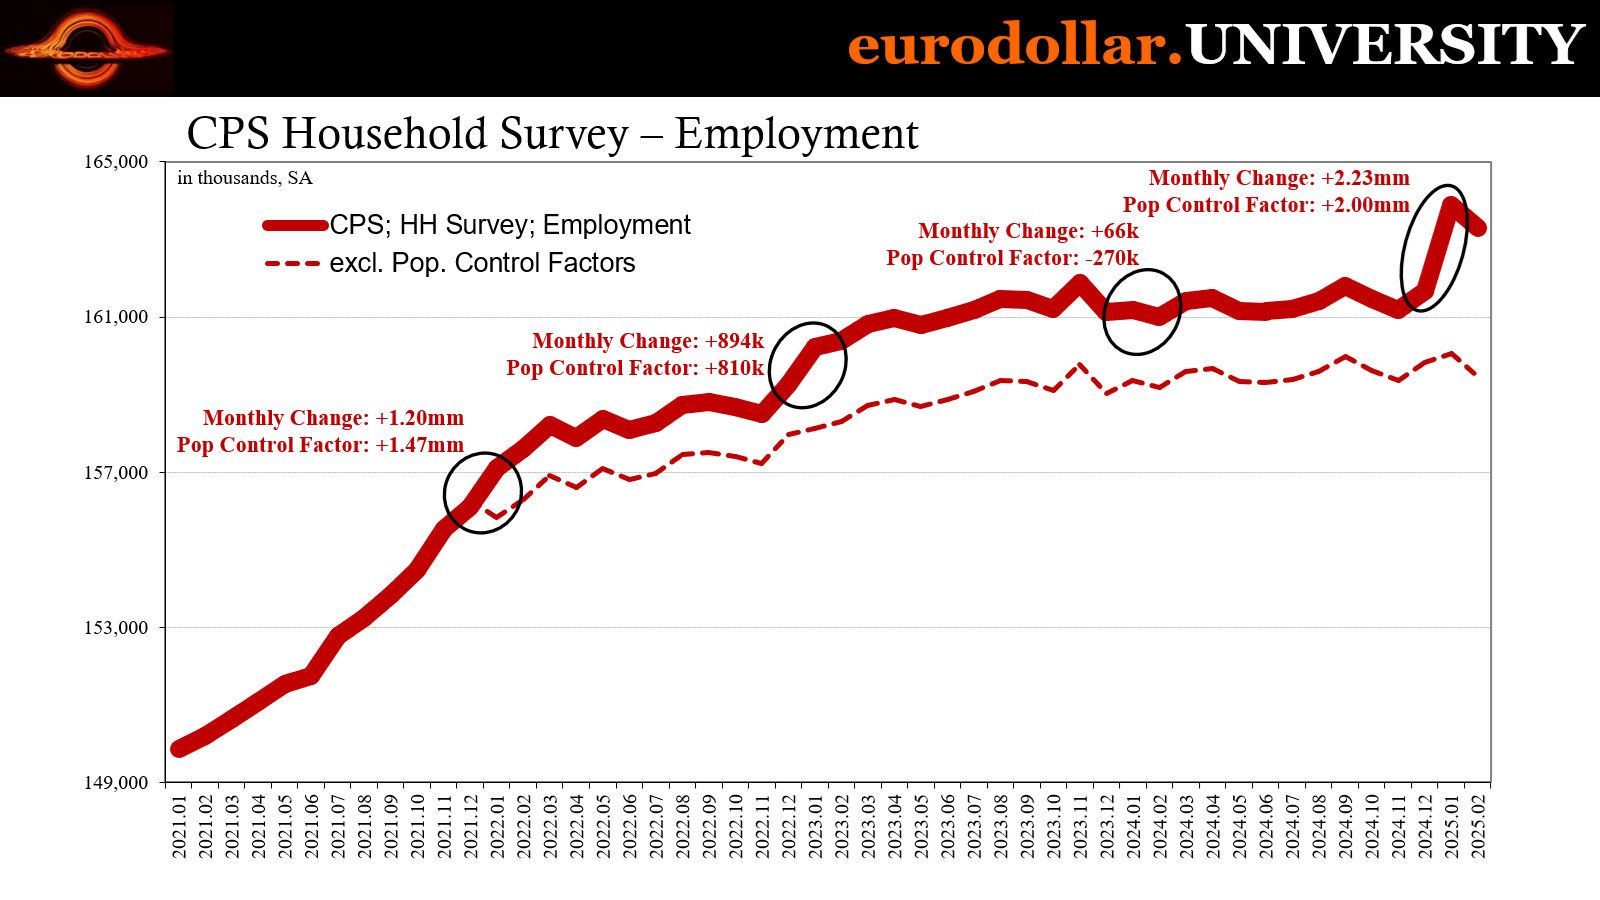


That means the employment situation from the CPS perspective was even worse than it already appears. While around 600,000 lost positions, another 600,000 were involuntarily converted from PT to FT (keeping in mind these monthly figures are ballpark numbers and not precise to any significant degree).
The idea behind these estimates was also echoed by the other, more important part of the Establishment Survey – hours. For the second straight month, the average workweek held at just 34.1 hours, a rate matched only by March 2020 over the last fourteen years dating back to the early aftermath of the Great not-Recession, equal to November 2008.
To whatever degree, both surveys do describe a labor market where employers are substantially cutting hours for their employees whether or not they might be shedding them (or how many). These are not signs of a strong and resilient labor market by any means.
There’s much more.
The labor force itself saw nearly 400,000 leave since there aren’t any jobs. Those departures mean the official unemployment rate only increased by a tenth to 4.1%, another underestimation of how bad things are. However, the vastly more relevant participation rate slid to just 62.4%, its lowest since January 2023. When accounting for the nearly 1 million dropouts represented by that low rate, unemployment would instead be 4.7%, not 4.1%.
It's right back to where it had been in November prior to the artificial mini-renaissance, another indication that upswing is closing in on its last days.


While the BLS was able to ignore those LF dropouts, it couldn’t help but tally an astonishing surge of underused employees. The U-6 rate - often referred to as the official underemployment rate - soared by half a percentage point in February alone, reaching 8.0% for the first time since October 2021.
These estimates which pertain to the marginal (literally) segments of the labor market are solid cyclical indicators. However anyone might choose to define “recession”, what’s not for debate is that when these particular figures are rising (obviously for more than a month or two) it signifies a labor market that is increasingly unhealthy.
Start with those who are “marginally attached” to the labor force. These are former workers who had and have fallen out of the official labor force total since they hadn’t searched for work in over a month. Yet, they’ve told the BLS they did look at some point over the previous year and are available to work right now if a job opportunity (they’d accept) comes up.
The CPS says the number of people in this situation reached 1.73 million in February, and it has been rising since last August. There was a previous high in January 2024 which appears one of those short run fluctuations inside of what otherwise is a solidly rising trend. The trend itself dates unsurprisingly back to SVB and the bank crisis (yet another labor stat which implicates the aftermath of the episode; Powell can claim to have won the bank crisis battle, if more and more it sure looks like the Fed lost the bank and macroeconomic war).
At the previous two cycles (not counting 2020), the number of marginally attached workers had reversed and begun to rise shortly before each official business cycle peak. The last of those, the inflection didn’t come until October 2007, a mere two months before the start of that cycle. Prior to the dot-com recession, the number of marginally attached workers didn’t begin to climb until November 2000, a month before the start of the Fed’s rate cuts and four months ahead of the official recession.


We didn’t even see this kind of broad deterioration in labor conditions in 2019. While that may have developed at some point in 2020 had there never been a pandemic, the fact the count of the marginally attached was still on the downswing showed that the economic turn was in its earliest stages and hadn’t progressed to these more serious and alarming states. Compare that to 2023-25 when the labor market has been suffering at these critical edges for going on two years, with no sign of reversing.
It is, again, a measure of just how unhealthy the jobs market really must be. If 2019 was concerning to pretty much everyone up to and including Jay Powell, then what is today? It is complete and utter nonsense to say the economy is strong and resilient.
Other similar measures defend the same conclusion. Next to marginally attached workers are those working part-time for purely economic reasons. They aren’t doing it because they want to, rather their employers are feeling pressured enough to have to cut costs and reduce hours.
Unsurprisingly, like the marginally attached series, this one is a cyclical warning and with a longer lead-in time. Before the 2008 downturn, the data started moving higher from back in the middle of 2006 and kept slowly building right up to December 2008 (a warning that was equally ignored then).
While there was less of a leadup in 2000-01, prior cycles show how companies make substantially more of their employees into unwilling part-time ones quite some time before the economy reaches traditional recession definitions.


Of the eight of those (not counting 2020 or 1957-58 because the data begins in the period leading up to that one) the data covers, the average lead-in time is ten months. It has been as short as a few months, such as the dot-com experience and the double dip beginning 1981, with a few longer than a year including 2006 and 2007.
It is important to note neither these figures nor the underlying aspects of the labor market they relate to are timing signals. They can’t tell us when a traditional recession might begin, merely that the probability is rising with each increasing month of marginally attached workers and those getting stuck on part-time.
Therefore, however anyone chooses to see the recession question, these are all very clear signs of an increasingly unhealthy labor market independent of it. And if the employment situation in the economy is becoming this clearcut wrong-footed in so many ways, the chances of it being strong and resilient are about as high as the Federal Reserve’s interest rate policies achieving their stated goals, or Keynesian fiscal “stimulus” being able to buy more than eight jobs per million dollar outlaid.
In other words, next to zero.
Not only does the broader data – Establishment Survey included – conclusively end up on this interpretation, it also consistently points to deterioration in it. The CPS numbers speak for themselves on that score. Headline employment (CPS), if you remember, contracted sharply in October and November (the second of those proving the first one, October, wasn’t storms or wasn’t entirely hurricane related). The data turned around in December and January, the artificial high, only to collapse in February echoing the sharp loss of momentum in other series such as consumer confidence (related to labor conditions).
Both series, then, correspond to that late ’24 pattern and each one indicates a rolling over and payback period here in ’25, if differing on the extent of it so far.
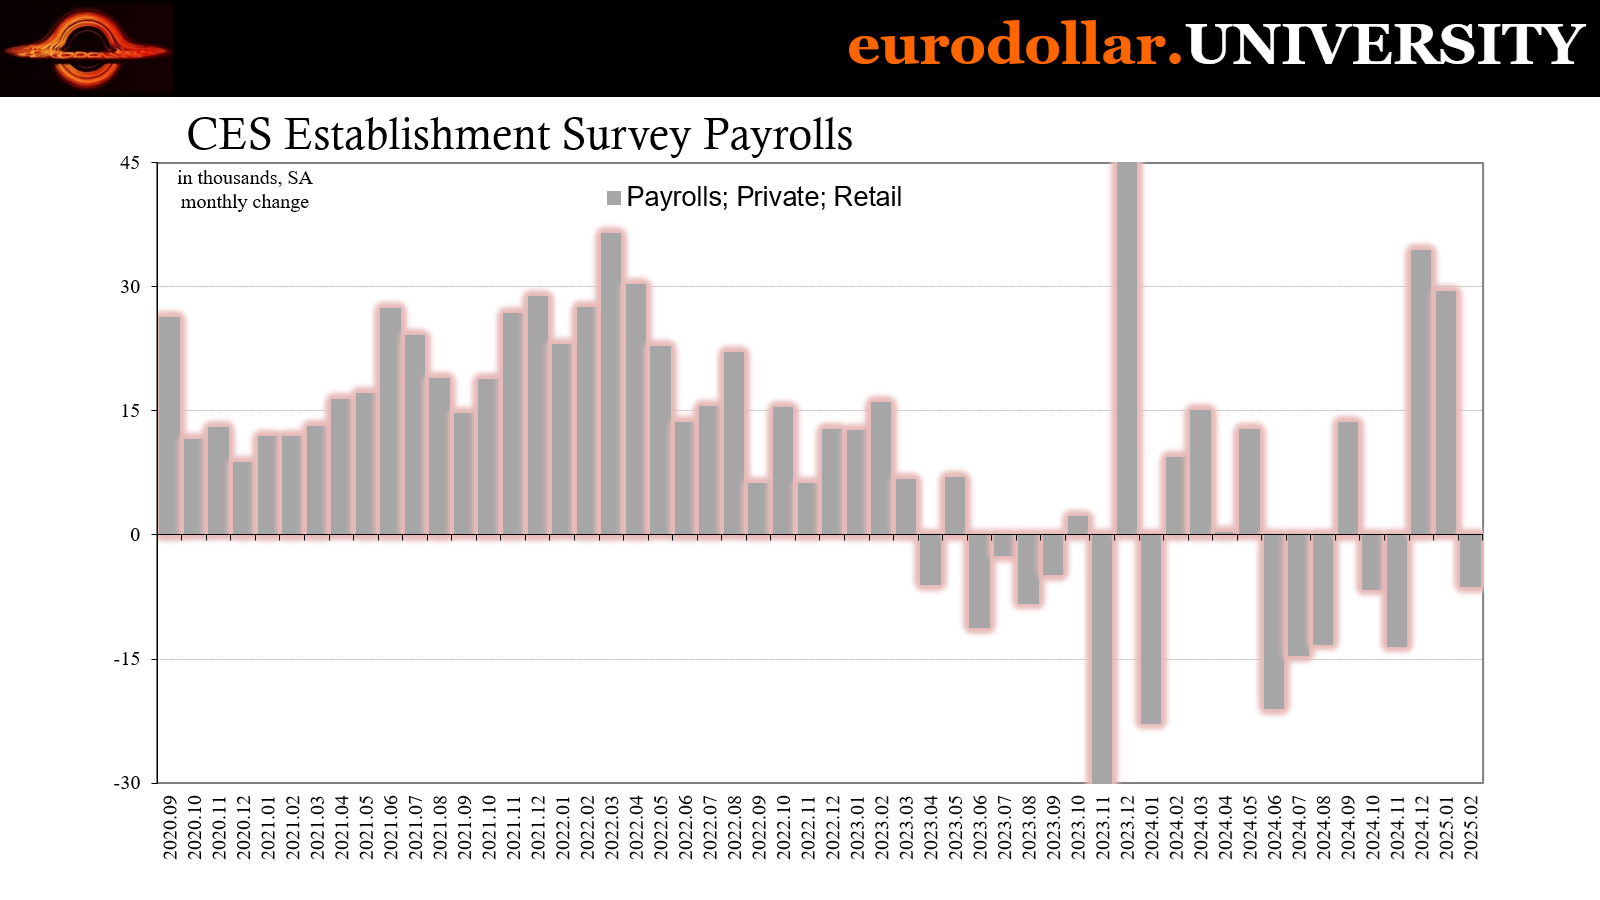
Digging into the CES even more, looking at the individual industries shows the pattern from the CES perspective might be more about timing than any other factor. For example, retail sector jobs saw a significant rebound in December and January, rising an impressive 64,000 combined in the two months, versus -55,000 over the six months prior to them.
For February, retail jobs are being shed once more as the artificial upswing begins to disappear. Same for the highly cyclical professional and business services industries, if offset by a month compared to retail. Companies operating in that broad category had fired a net 104,000 over the half-year through October, then brought back a combined 73,000 during the high in November and December, then went right back with 39,000 job losses again in January followed by an another 2,000 in February.


But where those industries appear to have completed their mini-cycles, many other cyclical industries are still on the upside of theirs.
Manufacturing is one. Not surprisingly, jobs in the segment were higher in February as producers are rushing right up to the very last minute to get goods made prior to tariffs being imposed. When you look at the four goods economy sectors together (manufacturing, retail, wholesale, and transportation/warehouse), the total number of jobs in them has been rising since October and have kept up through at least February.
Rather than signaling a meaningful cyclical shift, it makes perfect sense given the artificial flow of goods that is still pumping a huge number of items into the American economy. The mini-cycle has yet to fully dissipate in these areas. Add that to the natural overstatement of jobs in others, the Establishment Survey is picking up the downside if nowhere near the same degree as other data like the CPS.
We know that’s how this is going to play out by all the other evidence in the economy, from aforementioned consumer confidence to spending and an array of “soft data.” So, again, setting aside the question of whether any of this might meet the mainstream definition of recession, these are not signs of a strong labor market holding up in the face of an array of headwinds. They point instead to those negative pressures materially harming the economy and, in this case, destined to turn more forcefully around and head back toward its summertime position.

At best, then, the jobs market is unhealthy, and on the other end it might already be holy crap if taking the HH Survey deterioration, and the huge loss of momentum it describes, as literally true.
From that we can draw a couple of solid conclusions. First, more and more the artificial uptrend to end last year is proving to be just that; transitory and artificial, the product of a couple factors, rate cut euphoria plus election optimism boosted by a substantial frontloading of global demand intended only to beat tariffs. All of those point to more – not less – retrenching over the months ahead, a prospect which is animating financial volatility all over the market spectrum.
Second, whatever anyone thinks about the shape of recession, the American labor condition is nowhere close to stable, strong, or resilient. It is indeed a mess and is getting worse, doing so in a way that is consistent with downswings in prior cycles even if not in a straight line or in ways that might meet arbitrary cycle requirements.
The thing is, everyone keeps referring to “uncertainty” as an excuse for why various macro components aren’t going the way they would if the economy was actually strong or resilient. What the data shows, all of it, is that the economic condition actually keeps getting more certain, not less.


